


| |
Author: <jwalters@computer.org>
This howto is a first pass at illustrating the procedures required to use NetBeans to develop and debug EJBs running within JBoss. It will also discuss how to make the JBoss source available so that debugging can include JBoss code. It is not the purpose of this howto to describe how to develop and debug the JBoss code.
Because Sun's Forte for Java and NetBeans share much of their source code, this howto should be applicable to users in that environment as well.
For the purpose of this howto, I installed the JBossTomcat release version 2.4.4/3.2.3 into /opt/appserver on my linux box. If you translate the steps into Windows NT/2000 you can also debug JBoss apps using Netbeans there. Download it from http://www.jboss.org and select the binary link from the page. Don't worry about downloading a binary package, when all you want is the source code; the binary package also contains the source code used for building.
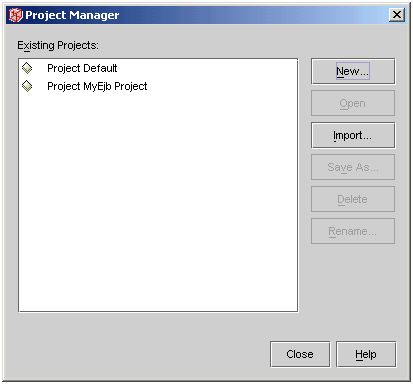
Start NetBeans, I used NetBeans 3.3 while writing this howto. The first step is to create a new project or open an existing project. You create a new project from the Project -> Project Manager menu selection. This dialog will show a list of your projects like:
This is a bit tedious, though it's not too bad. Once you have opened your project you should go to the explorer window and select the FileSystems tab. Either right click on the FileSystems entry in the explorer window, or choose File -> Mount Filesystem and pick mount jar. Use the browser or type in the path for the following jar files: jboss/lib/ext/jboss-j2ee.jar and jboss/lib/jboss-jdbc_ext.jar. If you are using JBossSX security then you'll also need to add additional jar files jboss/lib/jaas.jar, jboss/lib/jboss-jaas.jar and jboss/lib/ext/jbosssx.jar. If you are using JMS from your client you'll also need to add jboss/lib/ext/jbossmq-client.jar. Once you have added all these jar files a if you don't want them to show in the explorer you can right click on them one by one and from the properties panel select hidden=true.
At this point you need to add any other jar files specific to your app which need to be available to compile your project, e.g. log4j.jar if you are using the Apache logging framework.
Now you should be able to mount the directory containing your source code and compile it by right clicking on the root package and selecting compile all.
In order to build a jarfile from which to deploy your EJBs you'll need to add a new jar packager element to your project. Select File -> New and then from the Wizard select Jar Packager -> Jar Contents. This will take you into the Jar Packager wizard. It will allow you to specify the name of the jarfile, select and filter the contents of mounted filesystems for inclusion in the jarfile, and the output directory for the jarfile.
I have never seen POSIX filters before myself, there is good help available within NetBeans. The short version is that a filter to include .class files is \.class$. You could include .class and .xml files with a filter like (\.class$)|(\.xml$). See the online help for more details.
You will need to make sure that you include all required .class files as well as deployment descriptors in the META-INF directory. You right click on the Jar Contents and select "compile" to create the jar file.
After you have built the deployable jar file or war file you can deploy it into your JBoss server. If you want NetBeans to deploy the jar/war file for you then make the output location the jboss/deploy directory and you'll be on your way. Otherwise you'll need to manually copy it from where NetBeans writes it to the jboss/deploy directory.
Since these instructions are not for debugging JBoss so much as an application running in JBoss, at the moment the instructions will start JBoss from the command line and then attach the debugger. At some point in the future we can augment these instructions with instructions to launch JBoss from within NetBeans.
Make the following changes to your run.bat/run.sh file, or copy run.bat/run.sh to a new file debug.bat/debug.sh and paste the text in. This text is the Windows version, the UNIX version should use $env-var instead of %env-var%. Change the command line from:
java %JAXP% -classpath %JBOSS_CLASSPATH% org.jboss.Main ...
to: (as a single command line)
java -Xint -Xdebug -Xnoagent -classpath "%JBOSS_CLASSPATH%" -Xrunjdwp:transport=dt_socket,server=y,address=12999,suspend=n org.jboss.Main %1 %2 %3 %4 %5 %6 %7 %8 %9
The -Xint switch disables hotspot optimizations. This is not strictly necessary, but in my testing with the Win32 JDK 1.3 the JVM seemed more stable with this switch enabled.
You can of course substitute your favorite port for the 12999 in the example.
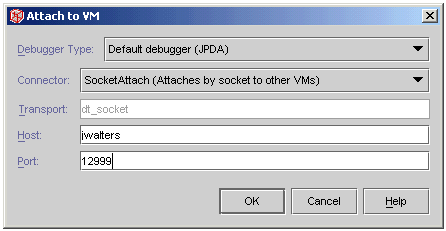
Once you startup JBoss then you can attach to it from NetBeans to do your debugging. Select the Debug -> Attach menu selection in NetBeans and then the debugger type should be default debugger JPDA. Select the SocketAttach in the connector dropdown and then enter the port number you selected when you edited the debug.bat/debug.sh file. The hostname should default to your local hostname when you select SocketAttach. After you complete filling in the debug "Attach to VM" dialog it should look something like:
Start JBoss using the debug script which you previously created. Deploy the EJBs you'd like to debug. If you want to see your beans being instantiated by the deployer, place breakpoints on the bean constructors (if you specified them) You will not need to have a client running to exercise this functionality.
Before you can debug, it is necessary to put breakpoints into your code. On the client side you can just open up your source files and toggle breakpoints as in any other Netbeans debugging effort. To put breakpoins into your ejb's is different. You will need to use the loaded classes menus to select the class and method you would like to break on. Once you have hit a break point within the class, and the source code is displayed, then you can add additional breakpoints. This seems to be an artifact of the class loading scheme used by JBoss, and a problem within NetBeans where it puts a breakpoint on the system classloader when you just open the source file and toggle a breakpoint.
To really debug your beans you will need to start up a client application. The easiest way to do this is either with a command line client, or else with a servlet/JSP client running inside any embedded or otherwise servlet container. One thing though, the timeouts are somewhat short so if you spend too much time in a method within the EJB you may find that transactions are rolled back.
 | |